
The study provides quantitative evidence of the profound demographic, social, and psychological impact of the Genocide. Among respondents who were adults in 1994 (called Genocide Generation Adults), 34% reported having experienced the murder or unexpected death of a close family member; 22% witnessed severe injury or death; and 28% experienced malnutrition. Females reported higher rates of family loss, illness/injury, and physical/sexual violence than males. Males were more likely to have witnessed violence and been forced to flee during the Genocide. The Post-Genocide Generation, born after 1994, reported less knowledge of family trauma, with a significant gap in awareness of specific traumatic events. (Figure 5.16)
Rather than single roles (e.g., victim, perpetrator, rescuer), most reported having multiple roles during the Genocide that would likely have depended in part on circumstances affecting the various needs and capacity to act under dire situations. Among Genocide Generation Adult respondents, 14% self-identified as being targeted; 19% faced harm for reasons other than being targeted; 37% refused to harm those targeted; 32% refused to betray them; 28% helped those targeted; and 4% were later imprisoned for genocide acts. Of the 154 who candidly self-identified as having been imprisoned, 146 became baptized Witnesses after the Genocide and 8 were baptized Witnesses by 1994. (Figure 5.17)
Figure 5.16, Traumatic Events During the Period of the Genocide Reported by Those in Rwanda During the Genocide About Personal Experiences and Those Born After 1994 About Family’s Experiences
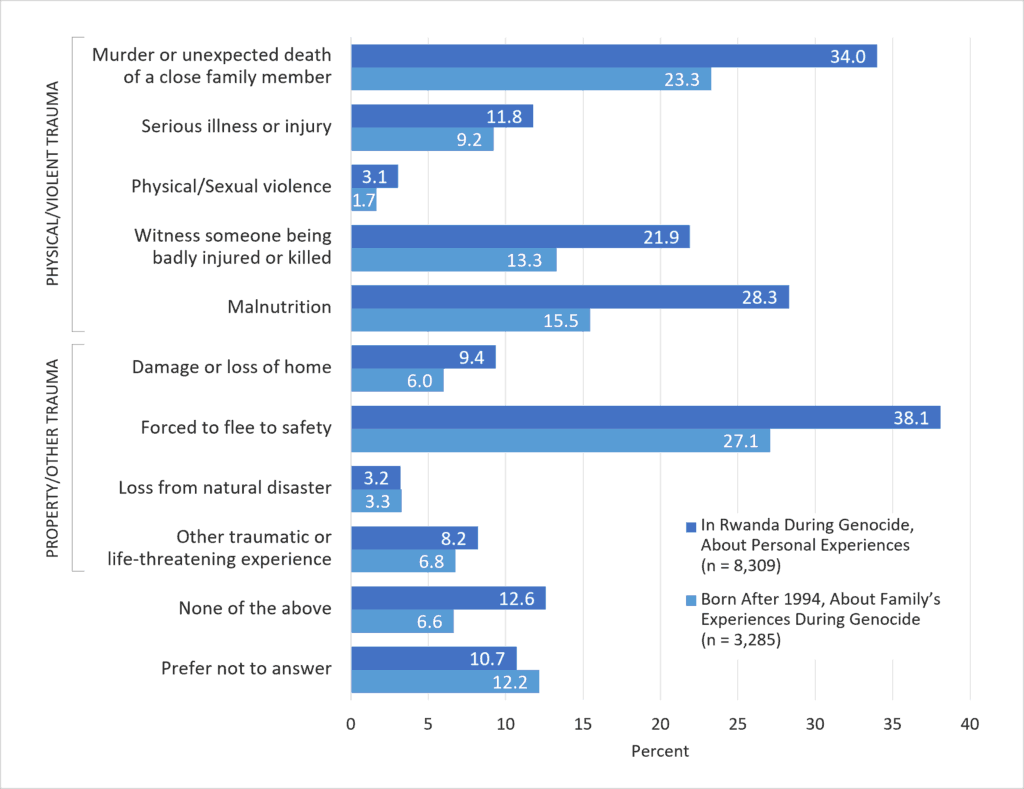
Chart Summary
The chart presents paired horizontal bars showing percentages of traumatic events across 11 response options for 2 groups, plotted on a 0 to 40% scale. The first group (n = 8,309) includes respondents who were in Rwanda during the genocide, reporting their personal experiences. The second group (n = 3,285) includes respondents born after 1994, reporting their family’s experiences during the genocide. The traumatic events are displayed under 2 categories: physical/violent trauma and property/other trauma. Prefer not to answer and none of the above were also possible responses.
Regarding the 5 items listed under physical or violent trauma, the chart shows higher percentages for those reporting their personal experiences compared with those born after the genocide and reporting their family’s experiences:
- 34.0% vs. 23.3% witnessed murder or unexpected death of a close family member.
- 21.9% vs. 13.3% witnessed someone being badly injured or killed.
- 28.3% vs. 15.5% experienced malnutrition.
- 11.8% vs. 9.2% experienced serious illness or injury.
- And 3.1% vs. 1.7% experienced physical or sexual violence.
Under the category of property and other trauma, personal experience respondents again report higher levels than those born after the genocide reporting their family’s experiences:
- 9.4% vs. 6.0% reported damage or loss of home.
- 38.1% vs. 27.1% were forced to flee to safety.
- 8.2% vs. 6.8% reported other traumatic or life-threatening experience.
- While loss from natural disasters is nearly identical between the 2 groups at 3.2% vs. 3.3%.
The remaining response options comparing personal vs. family experiences respectively show 12.6% vs. 6.6% selecting none of the above, and 10.7% vs. 12.2% selecting prefer not to answer. These findings appear in Section 5 of the report.
Figure 5.17, Role-Situations of Adults in Genocide Generation, Total and by Gender
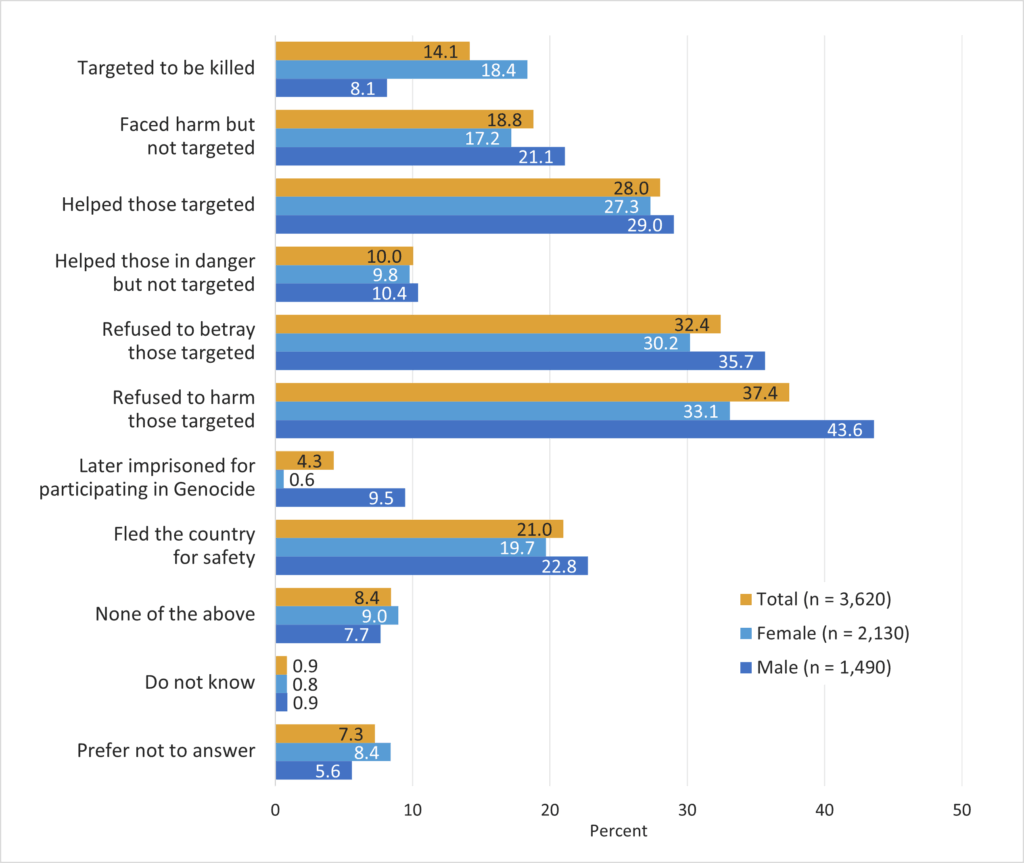
Chart Summary
The horizontal bar chart displays percentages for 8 different role situations experienced by adults in the genocide generation. Three additional response options are shown and include prefer not to answer, do not know, and none of the above. For each role situation, 3 bars are displayed showing the percentage for the total sample of n = 3,620 with its 2 groups of 2,130 females and 1,490 males, allowing comparison of gender distribution. The total and gender percentages for the 8 role situations are as follows:
- 14.1% total, with females at 18.4% and males at 8.1%, for Targeted to be killed.
- 18.8% total, with 17.2% for females and 21.1% for males, for Facing harm but not targeted.
- 28.0% total, with 27.3% for females and 29.0% for males, for Helping those targeted.
- Helping those in danger but not targeted is uniformly small (around 10%).
- Refusing to betray those targeted shows 32.4% for the total and higher male reporting at 35.7% compared with females at 30.2%.
- Refusing to harm those targeted is the highest category overall, at 37.4% for the total and 43.6% for males compared with 33.1% for females.
- Later imprisonment for participating in the genocide is rare (4.3% for the total, 0.6% for females, 9.5% for males).
- Finally, fleeing the country for safety is reported by about one fifth of respondents, both male and female.
Low percentages were reported for the categories of none of the above and prefer not to answer, each under 9%, with do not know responses reported at less than 1%. These findings appear in Section 5 of the report.