
Between the period one month before and one month after the Genocide, married-couple households declined, while single-parent and orphaned child-headed households increased. The decline in married-couple households was twice as high for females as for males. Over 40% of households of targeted Tutsi declined in size, double the rate for those not targeted. One fourth of targeted individuals were in single-parent households after the Genocide, a 10% increase from just prior to the Genocide. (Effect of Genocide on Household Composition in Section 5, Genocide and Trauma, page 214; Figure 5.12)
Figure 5.12, Change in Household Types, One Month Before and After the Genocide for Those Targeted and Not Targeted
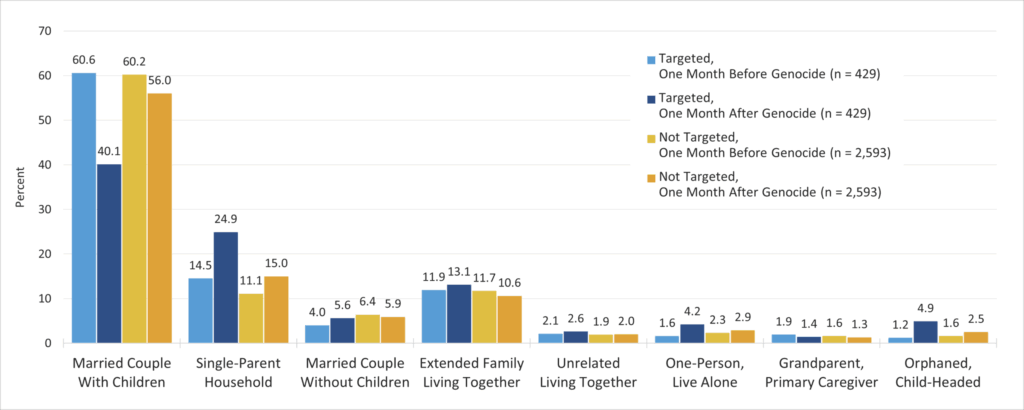
Chart Summary
The clustered bar chart shows percentages for 9 household types, 1 month before and 1 month after the genocide, comparing respondents who were targeted (n = 429) with those not targeted (n = 2,593). The comparison enables analysis of shifts in living arrangements. Each household category displays 4 bars representing targeted before, targeted after, not targeted before, and not targeted after the genocide, plotted on a 0 to 70% scale. Between the period 1 month before and 1 month after the genocide, targeted married-couple households with children decreased about 20%, from 60.6 to 40.1%. Those not targeted for this household category and timeframe show a decrease of only 4.2%, from 60.2 to 56.0%. Targeted single-parent households for the same period saw a 10.4% increase, from 14.5 to 24.9%. Married couples without children, regardless of whether targeted or not, and before and after the genocide, remain low, ranging between 4.0 and 6.4%. As for the extended family households, these increase modestly among the targeted, from 11.9% before to 13.1% after the genocide, and decrease slightly among the not targeted, from 11.7 to 10.6%. Smaller categories, such as unrelated living together, one-person households, grandparent as primary caregiver, and orphaned or child-headed households, show small changes before and after the genocide. Most notable were the one-person living alone households, which show for those targeted an increase from 1.6% at 1 month before the genocide to 4.2% at 1 month after the genocide. Those not targeted show a smaller increase from 2.3 to 2.9% for this same timeframe. Also notable were the orphaned or child-headed households, which show an increase among those targeted from 1.2 to 4.9% across the 2 months. Those not targeted show a modest increase from 1.6 to 2.5%. These findings appear in Section 5 of the report.