
Jehovah’s Witnesses in general have a positive forward-looking temporal orientation. Regardless of age or gender, they think about the present and future far more than past periods of their life. (Figure 6.19)
While some 30% report negative feelings associated with their childhood or the past, over 80% are positive about the present and future. (Figure 6.20)
Figure 6.19, Thinking About Different Periods of Life by Gender and Age Group
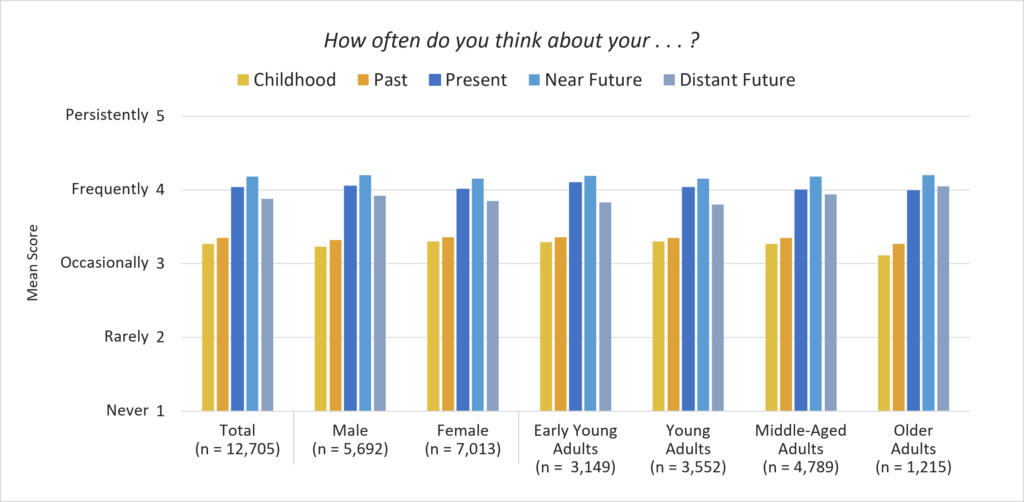
Chart Summary
The chart presents clustered vertical bars showing mean scores ranging from 1 to 5: 1 = never; 2 = rarely; 3 = occasionally; 4 = frequently; and 5 = persistently. Each bar in the 7 clustered groupings represents how often respondents think about each of the 5 time periods in life: childhood, past, present, near future, and distant future. The first of the 7 groups represents the total sample with n = 12,705. The next 2 groups represent the total sample broken down by gender: 5,692 males and 7,013 females. The final 4 sets of clustered bars show the total sample broken down by age groups: 3,149 early young adults; 3,552 young adults; 4,789 middle-aged adults; and 1,215 older adults. Across all groups, similar patterns are seen, with all results ranging between frequent and occasional thinking for the 5 time periods reported on. Frequently thinking about the near future displays the highest mean score for all groups. Present-focused thinking is consistently the second highest, just below near future. This is followed by thinking about the distant future at the third highest frequency. Regarding childhood and past time periods, scores cluster around the mid-range of occasional thinking for all groups. For all time periods, males and females exhibit nearly identical bar heights. Across the 4 age groups, consistent rankings are seen, with only small declines in distant-future thinking from older adults to the younger groups. These findings appear in Section 6 of the report.
Figure 6.20, Temporality, Feeling About Different Periods of Life, Total Sample
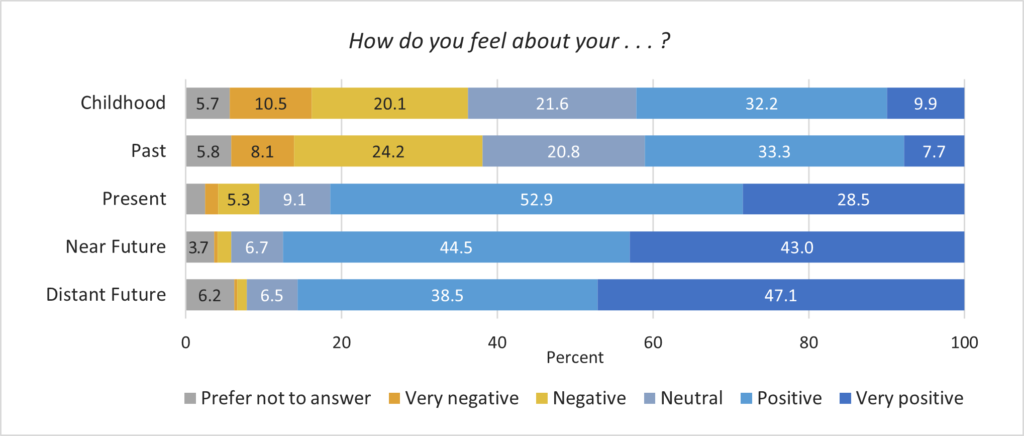
Chart Summary
The chart displays stacked horizontal bars with percentages showing how respondents feel about 5 life periods: childhood, past, present, near future, and distant future. Each bar is segmented into 6 response categories: prefer not to answer, very negative, negative, neutral, positive, and very positive.
- Childhood shows a broad spread with 10.5% very negative, 20.1% negative, 21.6% neutral, and strong positive segments of 32.2% positive and 9.9% very positive. A small percentage (5.7%) reported they preferred not to answer.
- Regarding the Past, a similar pattern is seen, with slightly higher negative responses (24.2%) and slightly lower very positive responses (7.7%). Moderate neutral and positive portions are displayed.
- Responses about the Present are dominated by positivity, with 52.9% positive and 28.5% very positive, and only small negative or neutral segments.
- Near Future is also strongly positive (44.5% positive; 43.0% very positive), with minimal negative values.
- Distant Future shows similarly high optimism, with 38.5% positive and 47.1% very positive, and small negative and PNA sections.
These findings appear in Section 6 of the report.